FD-VD TMS layout
The vertical temperature gradient of the FD-VD active volume will be monitored from fifteen different locations distributed throughout the module. At each position, three fiber arrays will be installed vertically, each containing 25 FBG sensors. Figure 1 shows an example of the installation distribution of these FBG fiber arrays in FD-VD.
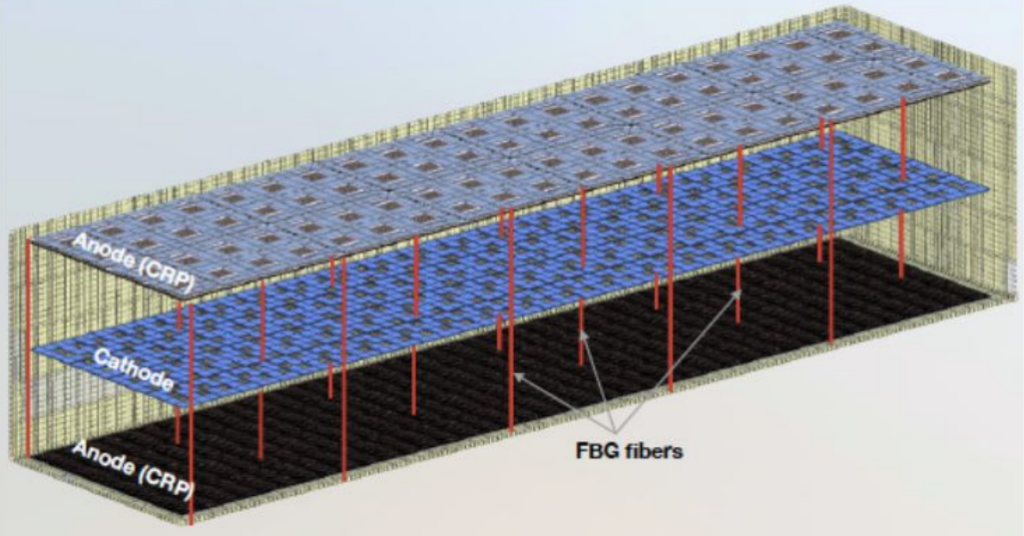
Figure 1. FD-VD Temperature Monitoring System layout.
The set-up must ensure the straightness of the system fibers to prevent possible deposition of charged particles driven by the vertical electric field. For this purpose, the fibers will be routed from the top anode to the bottom anode through the cathode, with a weight (one per fiber) attached at the lower end to maintain their alignment. Moreover, the three fiber arrays will be encapsulated within a Teflon tube, which will protect the fibers from breaking and, in the worst scenario that a fiber breaks, would also protect the active volume by containing the detached fragment.
Sensor Sensitivity
A detailed understanding of each sensor’s behavior is essential to predict how it will respond during system operation. This requires studying temperature gradients by analyzing the wavelength shifts of each FBG when they are exposed to cryogenic temperatures in the laboratory.
As part of the R&D efforts, different FBGs with various coatings materials and thicknesses are being studied to maximize measurement sensitivity and improve precision in monitoring temperature gradient changes. Additionally, measurements have been performed at different times under the same boundary conditions to study and verify the repeatability of the results.
Mechanical tests